
Dashboards
Interactive, self-contained dashboards that accompany my research and side projects.
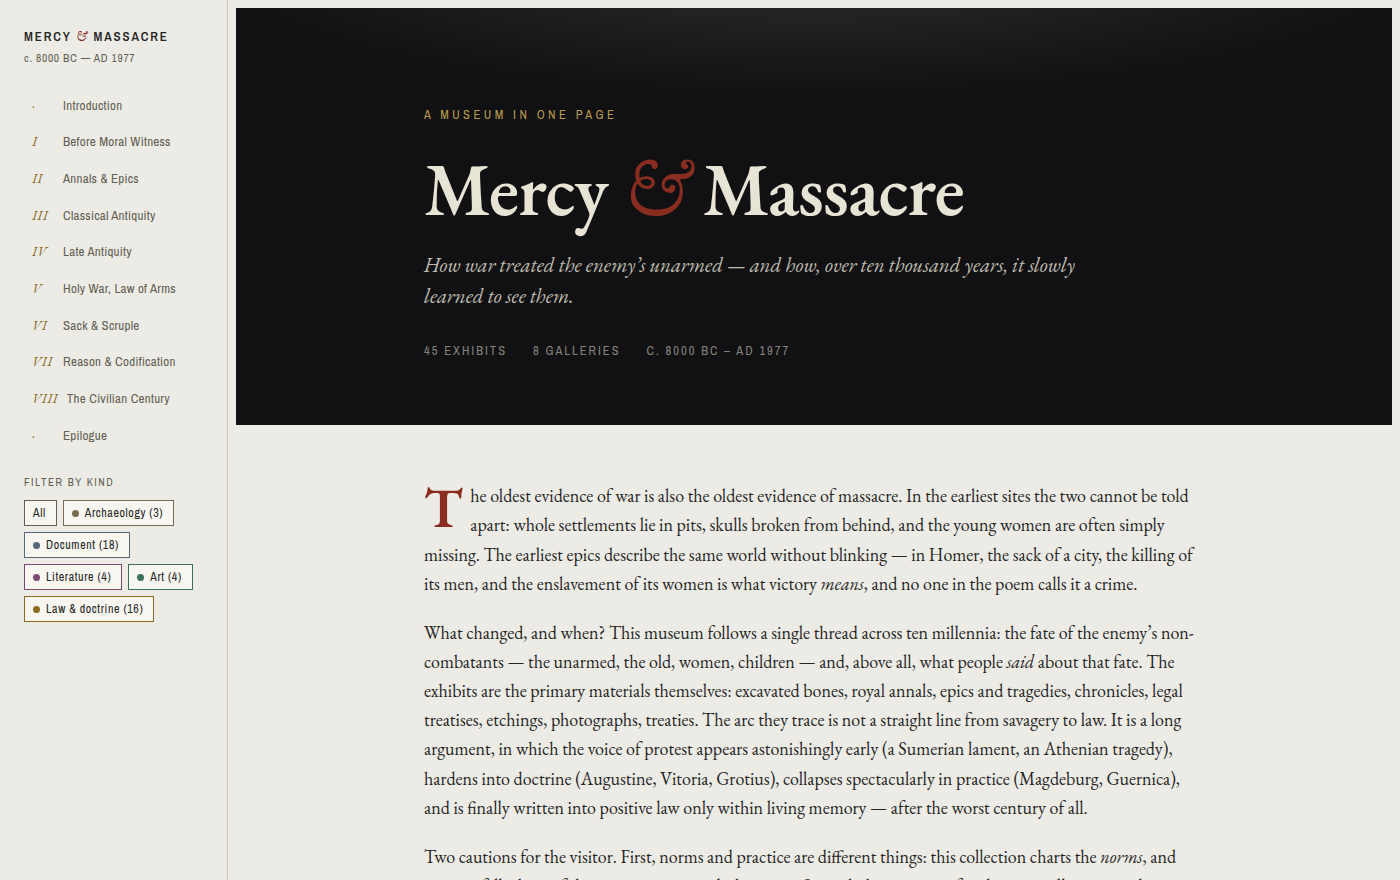
Mercy & Massacre
A custom museum-gallery web app I tasked Fable 5 with designing, writing, and curating end-to-end, to explore a single historical question: when — and how — did war learn to see the enemy's unarmed non-combatants? Forty-five exhibits across eight galleries — excavated bones, royal annals, epics, chronicles, legal treatises, etchings, photographs, and treaties — trace the slow emergence of the norms protecting civilians in war, from c. 8000 BC to AD 1977, with the primary sources left to speak for themselves.
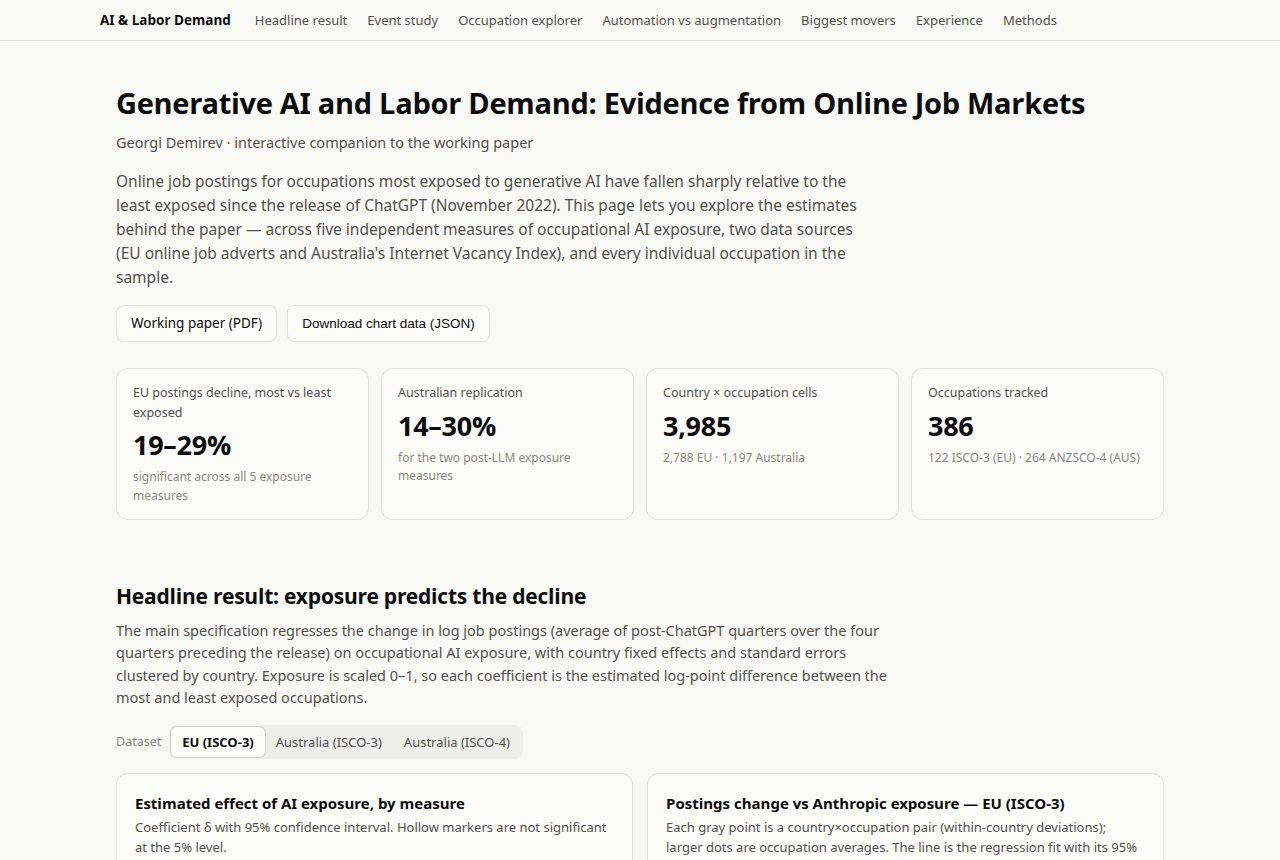
AI & Labor Demand
Interactive companion to my working paper AI and the Composition of Labor Demand. Explore the headline estimates, event studies, controls for alternative explanations, the automation-vs-augmentation split, and every individual occupation across five AI-exposure measures and two data sources (EU online job adverts and Australia's Internet Vacancy Index).
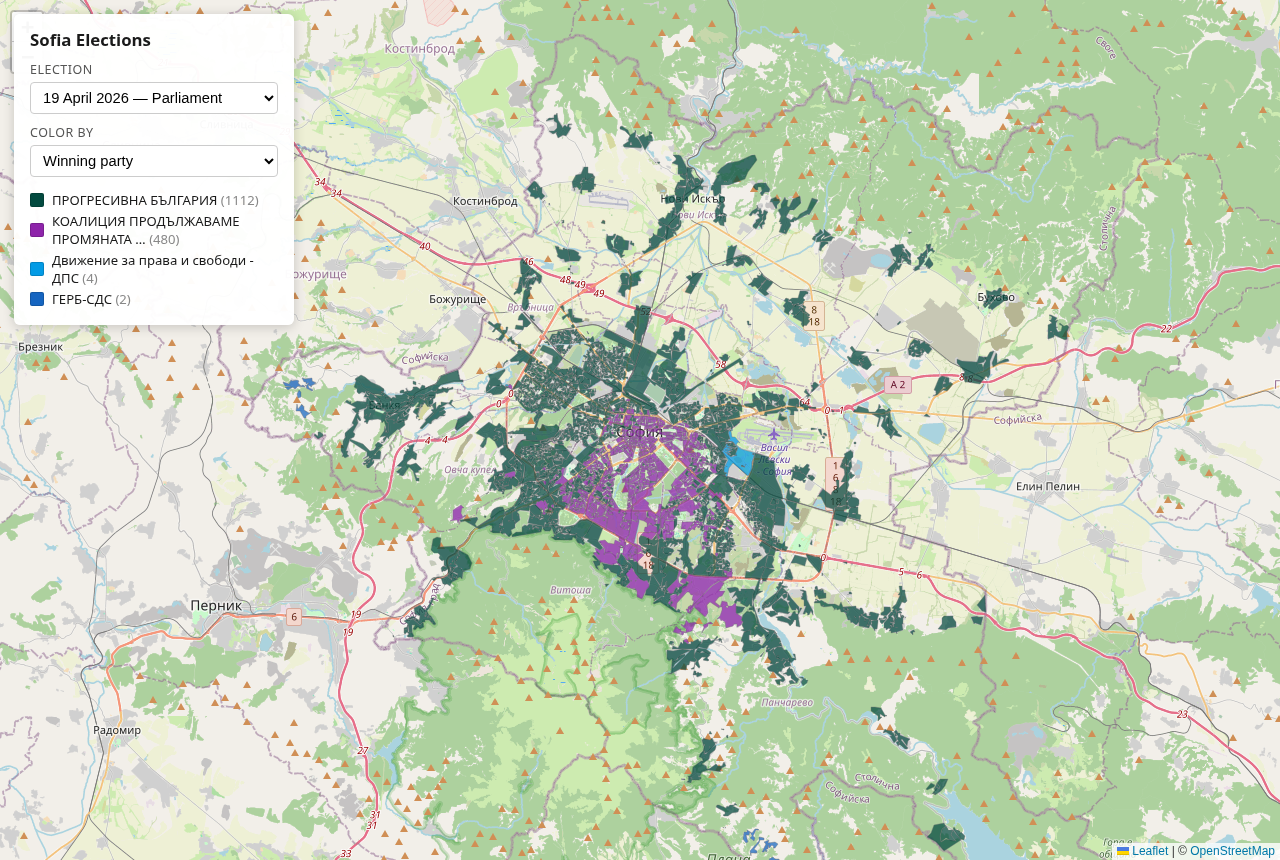
Sofia Elections
A precinct-level interactive map of recent election results across Sofia. Colour precincts by the winning party or by support for any single party, and switch between elections to see how the political map of the city shifts.